This is the fourth article in a series about Safety Management Systems (SMS). In the first article (see page 48 of the January 2020 issue of Aviation Maintenance), we examined some hazard identification strategies (looking at ways to identify the things that could go wrong in our systems). In the second article (see page 48 of the May/June issue), we began looking at the process of using risk assessment to analyze identified hazards by explaining how to establish a “likelihood” scale that is relevant to your business needs, and how to calculate a “likelihood” for each identified hazard. In the third article (see page 48 of the July issue) we continued our examination of risk assessment by looking at the process of using “consequence” as a second metric for analyzing risk.
This month we will examine how to correlate “consequence“ and “likelihood” together to get a product that represents the relative risk associated with the hazard. We can use this risk product to help make risk mitigation decisions, and also to measure the effectiveness of our mitigation efforts.
I strongly recommend that you go back and read the first three articles if you have not looked at them recently. They are each pretty short, and they lay a foundation that will make it much easier to understand what this article is talking about. These prior articles are available in the back issues found on the Aviation Maintenance magazine website.
To review, we have previously discussed the identification of hazards (in the January 2020 issue), and the correlative assignation of likelihood levels (from the May 2020 issue) and consequence levels (from the July 2020 issue) to those identified hazards. If you are looking for more detail on how to assign these values, then please look at the earlier articles.
Typically, these assignments are only relevant within the system in which they are assigned. For example, one system might assign a likelihood level of 3 and a consequence level of 4 to a particular hazard, and another system might assign very different numbers to the same hazard. This could be because the scales of the systems are defined differently, it could be because the likelihood and consequence levels are themselves defined differently, or it could be because the hazard has different actual and potential effects within a particular system. The important thing is to use the system that you defined so that you can assign values that provide a relative risk rating. Such a rating will be relative to risks of other hazards identified and enumerated by your system.
Let’s look at the two scales that we used as sample for a repair station SMS in the past two articles. First there is a scale for likelihood (Exhibit A):

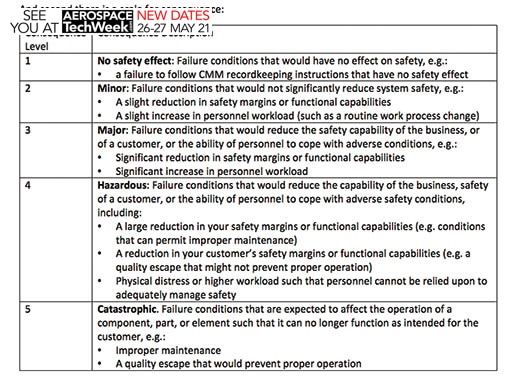
And second there is a scale for consequence (Exhibit B):

We’ve assigned numbers to the different levels (one through five in each case). By multiplying the numbers we can get a product. The product of the two represents a risk rating. For example, if likelihood is 4 and consequence is 4 (hazardous), then the product of the two is 16. If the likelihood of another hazard is 2 and the consequence is also 2 (minor), then the product is 4. These numbers are not absolute, so they do not tell us anything when analyzed outside of our system; but within our system they tell us that the first hazard (with a 16 risk product) should be a higher priority for mitigation than the second hazard (with a 4 risk product). This allows the owners of the system to prioritize their hazard mitigation projects to focus on the hazards that pose the most significant risk.
The simple multiplicative comparison is not the only way to approach these figures. For example, if your system prioritizes consequence over likelihood, then you might consider developing risk products by a formula like [consequence x consequence x likelihood]. This approach squares the consequence value which makes it a much greater influence on the final risk product number. For example, in a straight multiplicative model, a hazard with a consequence of 4 and a likelihood of 3 yields a risk product of 12; and a hazard with a consequence of 3 and a likelihood of 4 also yields a risk product of 12. They are weighted equally in such a model. But in the consequence-squared model, a hazard with a consequence of 4 and a likelihood of 3 yields a risk product of (4x4x3=) 48; while and a hazard with a consequence of 3 and a likelihood of 4 also yields a risk product of (3x3x4=) 36. Now the first hazard is prioritized over the second one for purposes of identifying an order in which to mitigate the hazards. Notice that our hypothetical hazards did not change, but only the way that we analyzed them changed.
The products of the likelihood and consequence numbers can also be used to help us set mitigation targets. By examining the products, the SMS system-owner can determine which risk products are acceptable and which risk products are unacceptable. Those hazards that have risk products that are deemed to be unacceptable would need to be mitigated in order to reduce their risk products to an acceptable level. In the next article in this series, we will discuss risk mitigation strategies.
A matrix of acceptable/unacceptable risks might look like this (Exhibit C):

In this matrix, we have established that certain risk products are considered to be acceptable, and certain risk products are unacceptable. In our sample, there is also one risk product that is marked in yellow as “review:” this is for catastrophic hazards that would be unlikely to ever occur. When hazards in this yellow-review risk-product are identified, they will be subject to additional review in the system to determine whether to mitigate them (so it is not acceptable nor unacceptable until the review has assessed it). When the system is newly-implemented, there may be many hazards that pose unacceptable risks. The numerical products found my multiplying the likelihood and consequence numbers can be used as a mechanism for prioritizing hazards in order to determine which ones to mitigate first.
The goal is, of course, to mitigate all of the hazards to an acceptable level. In our matrix, this means reducing the likelihood or consequence to a low enough level to move the risk product into the green. Eventually, a measured approach to SMS hazards should reduce the risk associated with the known hazards to acceptable levels. But this doesn’t mean that we are done!
We can also amend our risk product matrices as experience shows us that certain risk products need to be prioritized, and also as successful mitigations help to reduce total system risk.
Perhaps, after working in the system for two years, our hypothetical SMS-owner will feel that the business has successfully mitigated the risks posed by many of the identified hazards, and now the business is ready to begin mitigating the next round of hazards. The business might change the acceptable/unacceptable risk matrix by lowering the bar for mitigation so that the new matrix looks like this (exhibit D) :
Notice that the new matrix has changed some acceptable risks to unacceptable, which means that the business will develop new mitigations to further reduce the risk products of hazards in those categories to acceptable (green) levels. It is possible that some hazards that were mitigated from red-to-green in the prior matrix might need to be further mitigated after this change resets the concept of what is acceptable.
This approach allows the business to use its risk product acceptable/unacceptable matrix as a tool for continuous safety improvement, by moving the levels of acceptable safety to force constant im-provement.

In the next issue, we will look at how to use mitigations in order to reduce likelihood levels and consequence levels of identified hazards. By changing the likelihood level, consequence level, or both, the system can effectively reduce risk posed by hazards. As we will see in future articles, this helps to drive an effective audit schedule as well as becoming an effective and objective change management tool. Want to learn more? We have been teaching classes in SMS elements, and we have advised aviation companies in multiple sectors on the development of SMS processes and systems. Give us a call or send us an email if we can help you with your SMS questions.
